How your neighborhood voted in 2016
Last week The New York Times published an interactive map showing the results of the 2016 presidential election at an incredible level of detail. A doctoral student at Washington State University, Ryne Rohla, assembled information about how people voted down to the voting district level. His work tallied information for each of the nation's 168,000-plus voting districts. We've mined that data to show you some of the more interesting parts about the neighborhood even down to the block level. These results afford a granular and often revealing perspective on underlying trends and stories, showing how voting behavior can vary within neighborhoods and even from block to block.
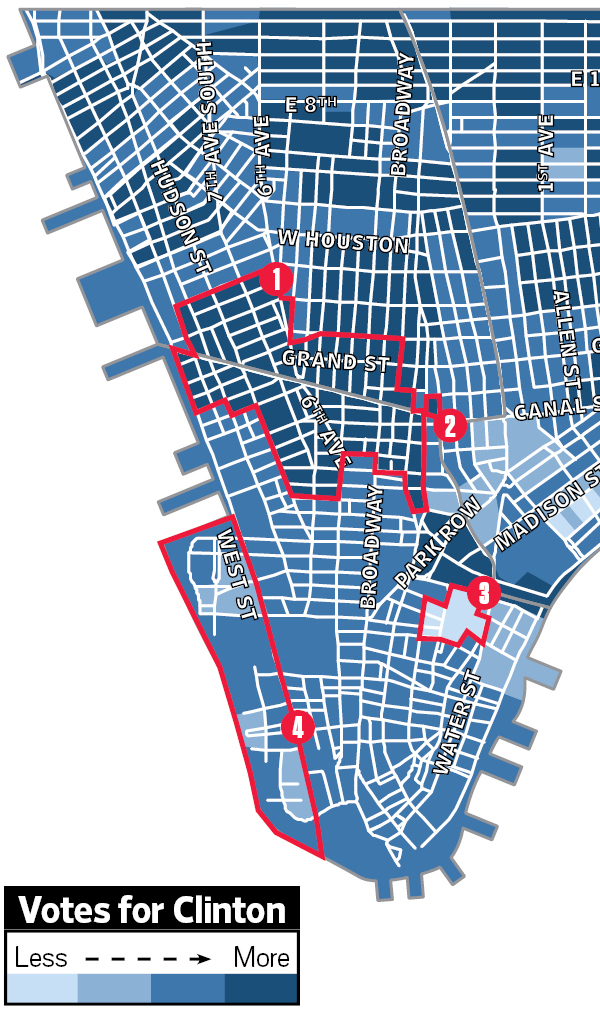
Published here are a few hyperlocal insights gleaned from The Times's map. 1. Clinton had overwhelming support in precincts along the western half of Canal Street, from Centre Street to the Holland Tunnel entrance, winning more than 88 percent of the vote in seven of eight precincts, and exceeding 90 percent in two precincts along Broadway.
2. Trump didn't receive a single vote in one tiny precinct in Chinatown that covers a single block bounded by Canal, Baxter, Hester and Centre Streets. Clinton won 11 votes in the precinct.
3. Two precincts covering Southbridge Towers, the former Mitchell-Lama development just south of the Brooklyn Bridge, and surrounding area had the highest proportion of Trump voters of any Downtown precinct. Trump earned 31 percent of the vote in both precincts.
4. Trump also performed relatively well in Battery Park City, where he won 20 percent of the vote in two of the neighborhood's nine precincts. Clinton won no more than 81 percent of the vote in any Battery Park City precinct, earning below 80 percent in six of nine precincts, underperforming her borough-wide rate.